19.10.2026
Occupational exposure limits are written for the air a worker inhales, not for the average air in a production hall. Many exposure assessments still rely on fixed monitors, occasional sampling campaigns or readings taken metres away from the task. Breathing zone monitoring closes this gap by measuring airborne particles within about 30 cm in front of the nose and mouth, where inhalation actually takes place. A worker who moves through a dust cloud at a grinder or bagging station may receive a dose that no wall-mounted device records. This article explains how standards define the breathing zone, which particle fractions matter and where samplers belong. How laboratory and real-time methods work together is set out in the white paper on combined monitoring.
Breathing zone monitoring in occupational hygiene standards
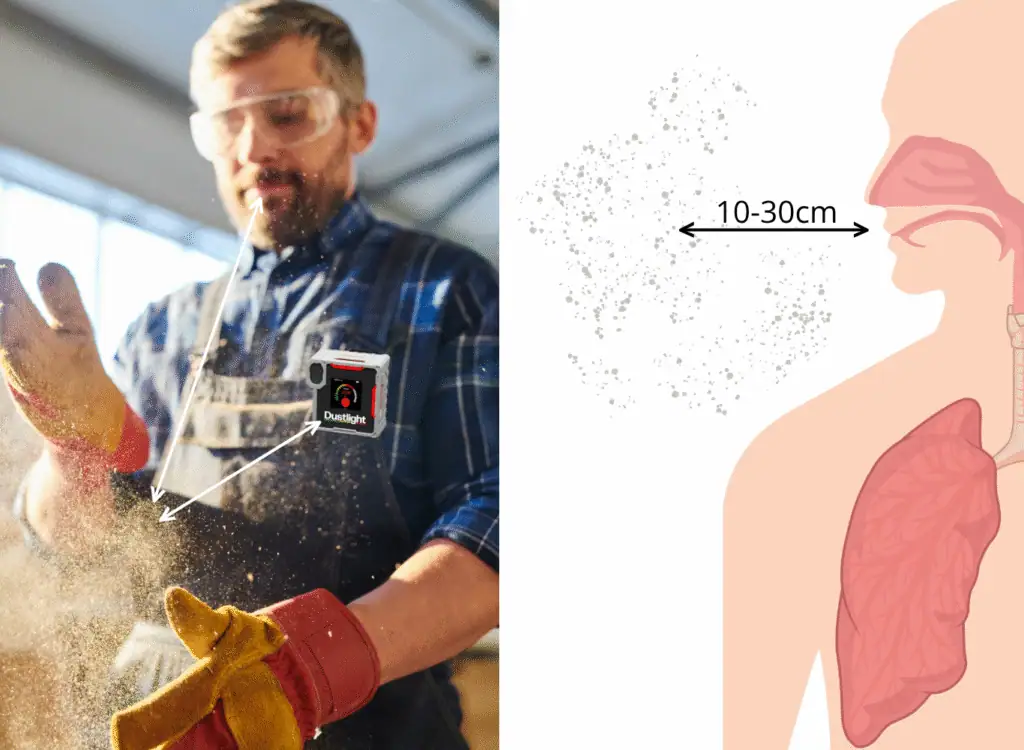
The breathing zone is defined in EN 1540 as the space around the nose and mouth from which breath is taken, described as a hemisphere of 30 cm radius in front of the face. Breathing zone monitoring means measuring airborne contaminants inside this space, so that results represent what a worker actually inhales.
What is the breathing zone?
EN 1540 centres the hemisphere on the midpoint of a line joining the ears. OSHA in the United States uses a comparable definition: a hemisphere forward of the shoulders with a radius of 6 to 9 inches, roughly 15 to 23 cm. OSHA also states that the sampler should sit as close as possible to the nose and mouth and outside all personal protective equipment. Both definitions describe the same principle: exposure is measured at the point of inhalation, not in the surrounding room.
Limit values across jurisdictions follow this principle. Workplace exposure limits (WELs) in Great Britain, OSHA permissible exposure limits (PELs), ACGIH TLVs, Australian workplace exposure standards and binding EU limit values all describe concentrations breathed over a reference period. In Europe, EN 689 sets out the strategy for testing compliance with these occupational exposure limits (OELs), and it is built on personal exposure monitoring.
The established way to sample the breathing zone is gravimetric. A pump with calibrated airflow draws air through a size-selective sampler clipped near the collar, and the filter is weighed in a laboratory. HSE MDHS14 and NIOSH Method 0600 describe the procedure. Gravimetric sampling remains the reference method for compliance in most jurisdictions, and the filter can be analysed further, for example by X-ray diffraction for respirable crystalline silica.
The gap between static readings and personal exposure
Static or area monitors measure the air at a fixed point, and their results are generally not treated as exposure measurements. HSE guidance G409 states that static results should not be compared against workplace exposure limits, because concentrations close to a worker can differ substantially.
Static monitoring still has clear value. A fixed instrument can show whether local exhaust ventilation works and where dust escapes from an enclosure. It needs no worker cooperation and often costs less than a personal campaign. Dustlight can also be operated as a stationary measuring point for exactly these control checks.
The limitation lies in the distance between instrument and person. Workers lean over the workpiece, hold tools at chest height and walk through plumes that never reach a wall-mounted device. A study by Ahmed and colleagues (2005) found that workers walking near a contaminant source received about 1.76 times the exposure of workers standing still at comparable locations. The authors recommended basing exposure estimates on personal sampling where possible.
Can static monitoring results be compared with workplace exposure limits?
In Great Britain, generally not, and OSHA compliance assessments are likewise based on personal breathing zone samples. An area value may underestimate exposure at the source or overestimate it for workers who spend most of the shift elsewhere. In a workshop where engineered stone is cut and polished, a monitor near the extraction wall may report moderate levels while the operator at the polishing station inhales considerably more. Only a measurement in the breathing zone shows which situation the operator is actually in.


Particulate matter fractions relevant to worker health
Beyond where a sample is taken, standards also define which particles it must collect: the inhalable, thoracic and respirable fractions of EN 481 and ISO 7708.
The respirable fraction penetrates to the alveoli, where particles such as crystalline silica can cause silicosis and lung cancer. Limit values refer to these fractions. OSHA sets a respirable PEL of 5 mg/m³ for particulates not otherwise regulated, and the ACGIH TLV for respirable particles not otherwise specified is 3 mg/m³. In Great Britain, COSHH treats any dust as hazardous at or above 4 mg/m³ respirable or 10 mg/m³ inhalable as an 8-hour average. For respirable crystalline silica, the EU limit under Directive (EU) 2017/2398 and the GB WEL are 0.1 mg/m³, while the OSHA PEL and the Australian exposure standard are 0.05 mg/m³.
Which is the right measure for workplace dust exposure?
PM2.5 and PM10 are ambient air quality metrics, and no occupational exposure limit has been set for them. Workplace exposure limits refer to respirable and inhalable dust; PM4 is therefore the PM fraction closest to the respirable convention, although the two are not identical. Smaller fractions remain informative: a high share of 1 µm particles can point to welding fume or diesel particulate, while a shift towards 10µm particles may indicate coarse dust from sawing or crushing. More background is in the overview of respirable dust measurement technology.
Dustlight records Respirable Dust and simultaneously also PM1, PM2.5, PM4 and PM10 using laser-based optical measurement. Because mass is derived from the optical signal, results depend on particle density, shape and refractive index. Dustlight therefore supports material-specific calibration factors, as explained in the article on Dustlight calibration factors. The optical method does not identify chemical composition, so silica content still requires laboratory analysis.
See how a 149 g personal monitor captures four particle fractions right where the worker breathes and raises an alert on the spot. Discover every specification, mounting option and software feature on the product page.
Sampler position and its effect on measured exposure
Within the breathing zone, the exact inlet position can still influence the measured concentration. NIOSH research in coal mining found that lapel samples differed significantly from samples taken at the nose, while cap-mounted samples were statistically similar to nose samples.
In der Studie von McWilliams, Vinson und Volkwein (2007) war der Unterschied zwischen Revers und Nase hochsignifikant (p < 0,0001). Zwischen Helm und Nase zeigte sich kein signifikanter Unterschied (p = 0,21). Je näher der Ansaugkopf an Nase und Mund sitzt, desto repräsentativer ist das Ergebnis vermutlich.
Where should a personal dust monitor be worn?
A personal dust monitor should be worn on the collar or upper chest, as close to the nose and mouth as practicable. The inlet should stay outside respiratory protective equipment and face shields. Where a task is clearly one-sided, such as angle grinding or hand sanding hardwood, placement on the side nearer the source may be considered. The chosen position should be documented so that repeated results stay comparable.
Dustlight uses the Klick Fast mounting system with more than 20 compatible accessories. The mounting eases correct placement but does not replace a check: a monitor worn on a belt or in a pocket sits outside the breathing zone.
Short-term peaks hidden inside shift averages
An 8-hour time-weighted average (TWA) can stay below the limit even when short tasks produce concentrations many times higher. Real-time breathing zone monitoring resolves these peaks minute by minute, which a single filter result cannot show.
A gravimetric sample delivers one average for its sampling period, often most of the shift. It shows whether that average was acceptable, but not whether the dose came from ten minutes of dry sweeping or six hours of steady background. Direct-reading instruments log concentrations continuously, so peaks can be related to activities such as emptying powder bags in food processing, fettling in a cast-iron foundry or dry cutting on a construction site. Such a match in time is an indication, not proof of cause. The article on TWA and STEL values explains how both reference periods are calculated.
Does a compliant 8-hour average mean workers are safe?
Not necessarily. Repeated peaks can contribute substantially to the total dose. For carcinogens such as respirable crystalline silica, the EU Carcinogens and Mutagens Directive requires exposure to be reduced as far as technically possible. COSHH similarly expects exposure as low as is reasonably practicable. A compliant average is a minimum requirement, not proof that exposure is under control.
Dustlight warns the wearer through an LED traffic light and an audible alarm with configurable thresholds, while the Dustlight software shows interim TWA, short-term values and particle size distribution. A TWA calculated during the shift stays an interim value until the shift ends. These results support daily prevention, but optical readings are not a substitute for prescribed reference methods. The pillar article on gravimetric and real-time monitoring describes how the two approaches can be combined.
Practical steps for a breathing zone monitoring programme
A breathing zone monitoring programme should start with a clear question, a defined group of workers and documented task conditions. EN 689 structures this approach around similar exposure groups and repeated personal measurements rather than a single sample.
The following steps can help safety teams produce comparable and defensible results:
- Define similar exposure groups of workers with comparable tasks, materials and controls, for example all operators at a hardwood sanding line.
- Document task conditions for every measurement, such as material, ventilation and humidity.
- Combine methods by using gravimetric sampling for compliance and real-time monitoring to identify tasks likely to drive exposure.
- Run parallel reference measurements so that a correction factor can be derived for the optical instrument.
- Repeat measurements after changes to processes, materials or controls.
Breathing zone data as the basis for effective controls
Measurements taken where workers breathe indicate which tasks drive exposure and therefore where the hierarchy of control should be applied first. They also show whether a control works once installed.
Once peaks have been related to tasks, substitution, wet cutting, on-tool extraction or enclosure can be compared by measured effect. A before and after comparison may show whether new extraction at a stone polishing station reduces respirable dust or only shifts it to a neighbouring workstation. Selection of respiratory protective equipment also depends on breathing zone concentrations, because the assigned protection factor must match the measured exposure. Dustlight makes such comparisons visible shift by shift, although the decision on adequate controls remains with the competent person.
Static readings, gravimetric samples and real-time breathing zone data answer different questions. Used together, they turn exposure assessment from a periodic snapshot into a continuous basis for prevention.
See breathing zone measurements from real shifts and find out how continuous exposure insight can fit existing sampling routines. A short personal demo shows the device, the alerts and the analysis software in action.
Frequently asked questions
For comparison with 8-hour limit values, sampling should cover a representative period of the shift, ideally the full shift. Short, high-exposure tasks can be assessed separately against short-term limits where these apply.
In most jurisdictions, compliance is still demonstrated with prescribed reference methods such as gravimetric sampling. Real-time monitoring is widely used to screen tasks, verify controls and target reference sampling.
Exposure values assigned to an identifiable worker can count as personal data under the GDPR. Employers should inform workers, define the purpose and involve works councils where national law requires it.